Disadvantage- You can use it continuously
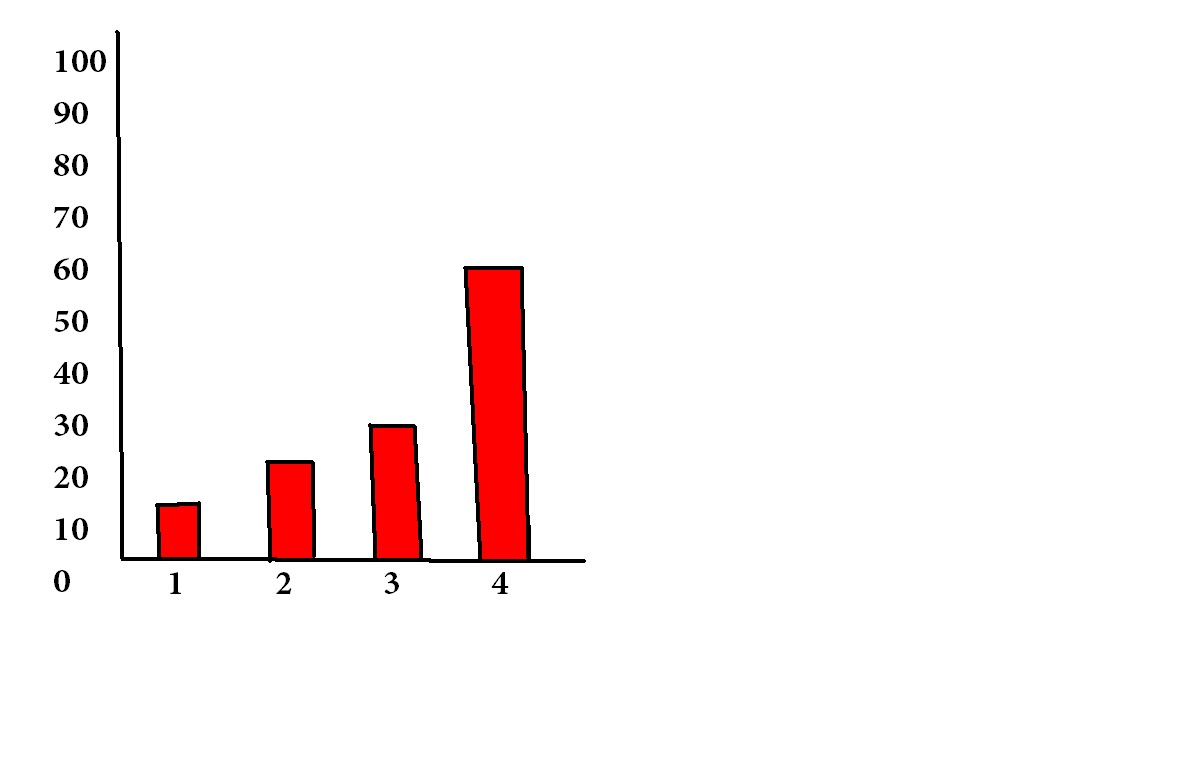
Bar Graph- advantage: it can compare large sets of data easily.
Disadvantage- Graph categories can be reordered to emphasize certain effects.
Double Bar Graph- Advantage-Can compare multiple continuous data sets easily
Disadvantage-Use only with continuous data
Circle Graph- Advantage-
Pictograph-Advantage -The advantage is it can compare large data sets easily using keyed icons
Disadvantage- It can only go up to 2-6 pictures.
2.) 1 way is the break in the y axis.
one of the bars are wider.
lastly the distorting of the visual.
2a) I would use line graph and bar graph

2b) yes because it would show how the pizza sub shop is improving in selling.
It explains because it showing the improvement.
4) I would use line graph because it shows more improvement than the pictograph.
4a)


No comments:
Post a Comment
Note: Only a member of this blog may post a comment.