This is a place for the community of learners in Room 8-14 to learn and enjoy math. It is an extension of the classroom making it accessible 24 hours a day, 7 days a week.
Sunday, March 11, 2012
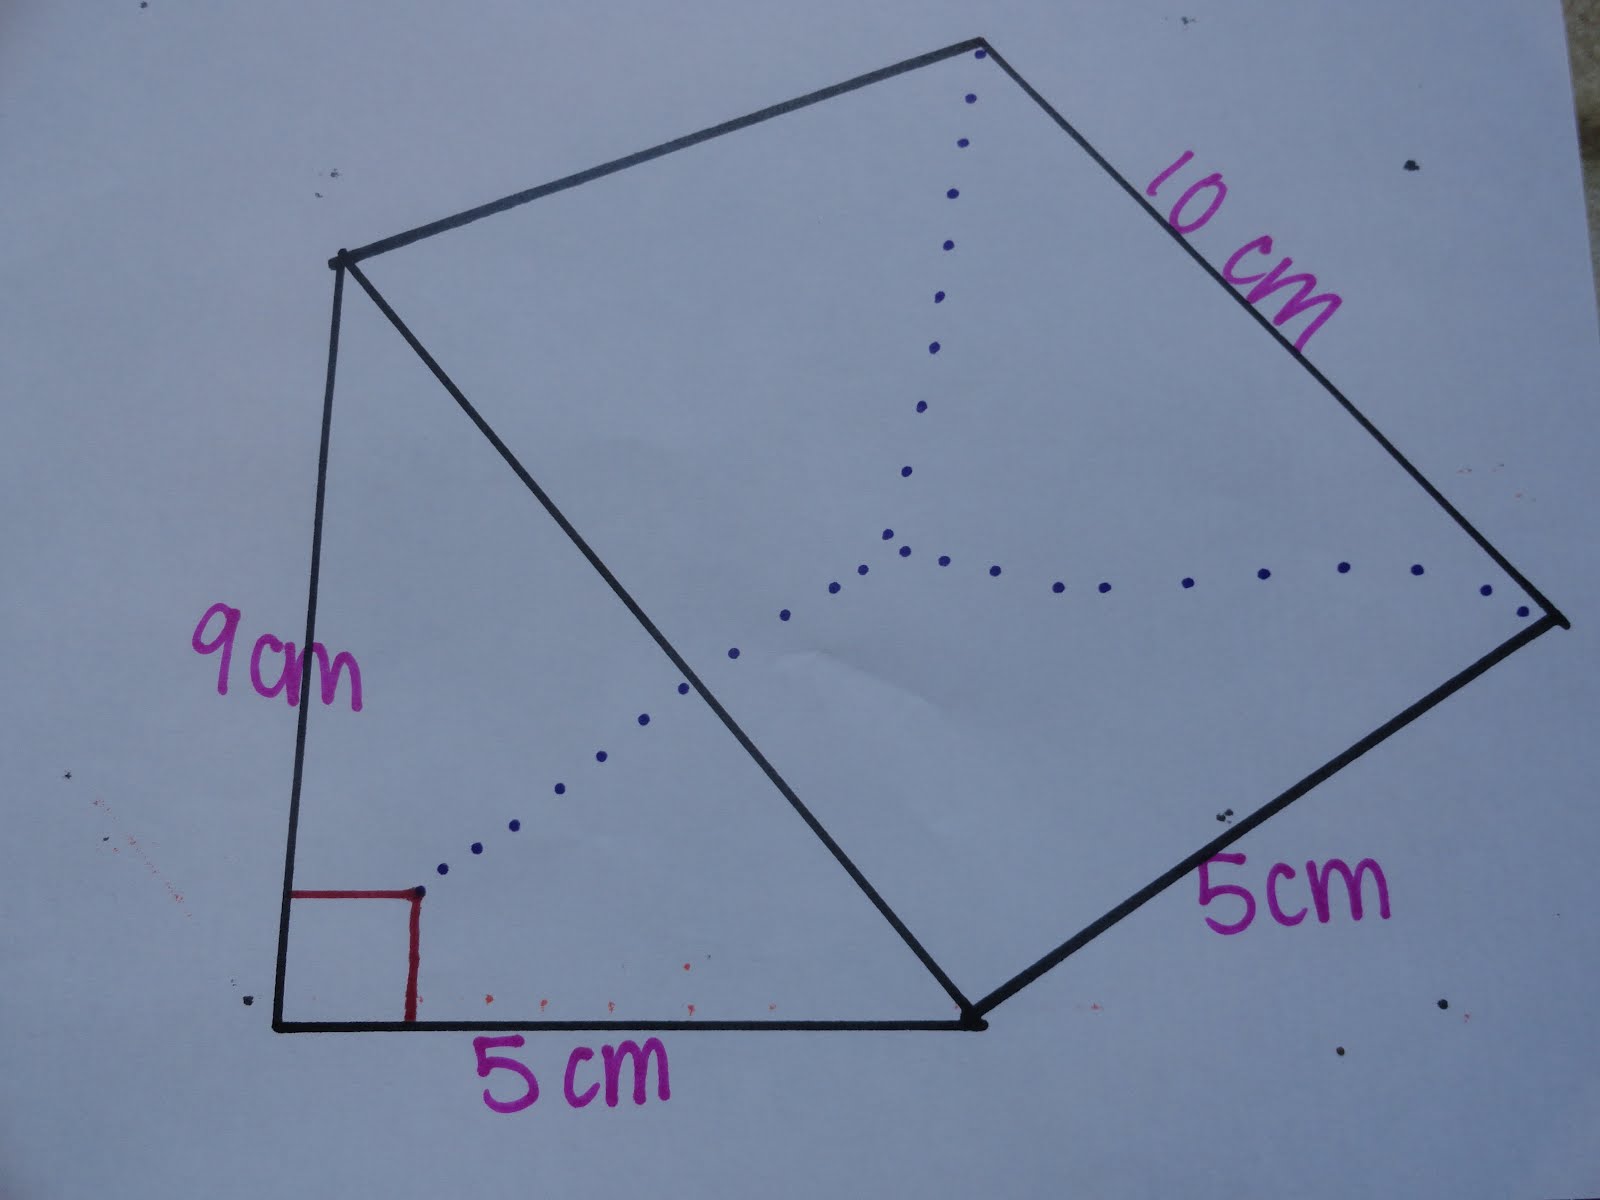
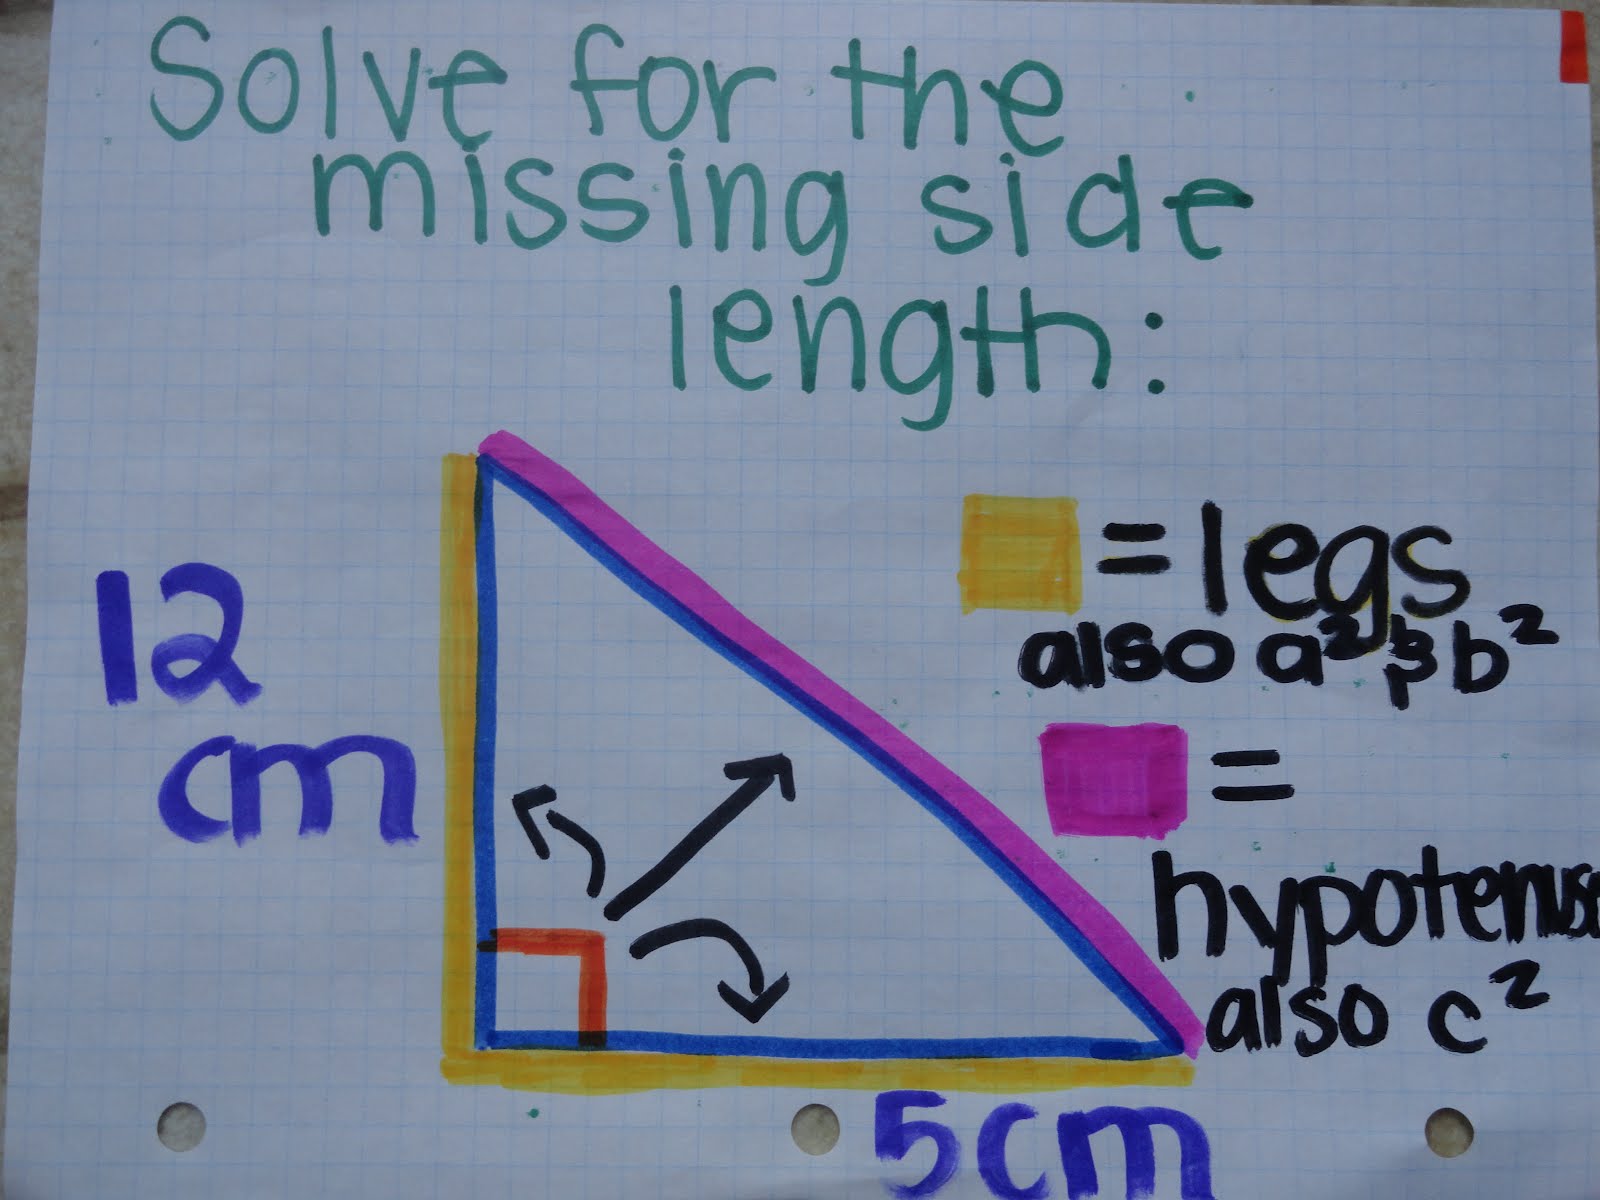
Janessa's Surface Area Post and Volume
Monday, January 9, 2012
Janessa's Scribe Post

3 x 3 9 32 x 2 4 2
Wednesday, November 30, 2011
We Day
Some performers were Hedley, Down With Webster, Shawn Desman and some others.
Here are some Pictures :all the speakers have changed my life with their inspirational words.
Tuesday, November 15, 2011
Janessa's Pay it Forward
In the movie Trevor's teacher gave the class an assignment to pay it forward. A boy named Trevor bought home a homeless man and took care of him. After Trevor thought of a plan where if he helped one person that person would help another person and then it would keep getting bigger and bigger and more people would get involved in pay it forward.
2. What was your Pay It Forward act of kindness?
My act of kindness that I chose was baking cupcakes for all the teachers and EA's at Sargent Park School.
Why did you choose this activity?
We chose this activity because we felt that baking cupcakes will put a smile on teacher's faces and in a way that is making a difference.
Who did you help?
We helped all the people working at Sargent Park School tun a bad day upside down.
What did you do?
First what we did was my group and I went to Michael`s and bought some thing to help us with the icing on the cupcakes. We also ended up going to Sobeys and buying the ingredients for the cupcakes. The next day Me, Ronalen, and Kassey all went to Kassey's house and baked honey cupcakes and iced them with vanilla frosting. Then on Monday at lunch we gave them out to all the teachers and EA`s at Sargent park school. Lastly, at the end we all got great feedback when we gave the cupcakes out. (:
When did you do you act of kindness?
We bought the ingredients on Saturday , baked the cupcakes on Sunday , and handed them out on Monday.
Part 3
How did your act of kindness go ?
Some people would even ask what is it so we would explain what it is and we would also explain part of the movie pay it forward so people would know what it is. Other said oh okay thank you very much I
Monday, November 14, 2011
Janessa's Percent Scribe Post
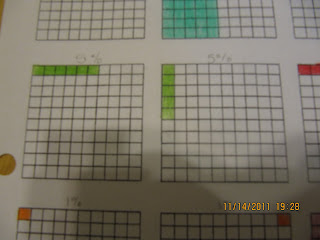
Percent- a fraction out of a 100
- out of 100
- fraction
- %
- looks like division
50% in 2 ways:


Sunday, November 13, 2011
Janessa's Graph Post
- Data can be presented using a bar graph , double bar graph , circle graph , line graph and a pictograph.
- Different graphs may provide different information and display certain types of data better.
Bar graph are best for comparing data across categories
Double bar graph are best for comparing two sets of data across categories.
Circle graphs are best for comparing categories to the whole using percents . The sum of all the percents in a circle graph is 100%.
Line graph are best for showing changes in data over time.
Pictographs are best for comparing data that can be easily counted and represented using symbols.
2.HOW CAN GRAPHS BE MISLEADING ???
This is a Pictograph , it is misleading because all of the trash cans are different sizes making it look like 2000 trash is more important. Make all the trash cans the same size !
This graph is a bar graph . It is misleading because the y-axis doesn't start at zero . It starts at 80 000 !
This graph is a line graph . It is misleading because although the vertical scale starts at 0, it does not go up in even steps. This distorts the graph, and makes it look as though the biggest jump is between 1 and 2, rather than 3 and 4.Also, there are no labels on the axes, so we have no idea what this graph represents!
2.a)
The two graphs that would show the work accurately is a line graph and a circle graph.
2.b)
I would keep selling because this line graph shows that the sales are going up.

I would choose the pictograph because it is more prettier , but the line graph makes the information look better because it shows the sales going up.